Tuesday, September 17, 2013

Examining whether the order of scaling and log-transformation matters

The following question has come up as I continue to explore datasets related to my current PostDoc work. Given a dateset that requires log-transformation in order to fit a normal distribution, does it matter if I log-transform then scale the data versus scale then log-transform?
First, let's get some data that could be considered as needing log-transformation to meet the assumptions of normality. I downloaded the dataset of plant specific leaf area (SLA) from Reich 1999, as used and cited in Logan 2012, from the websit associated with Logan 2012 here.
## Require packages
require(ggplot2)
## Loading required package: ggplot2
require(reshape2)
## Loading required package: reshape2

## Read in the data
LeafArea <- read.csv("~/Google Drive/Professional/Short-R-Examples/reich.csv")

## Quick peek at the data
head(LeafArea)
##   LOCATION FUNCTION LEAFAREA
## 1   Newmex    Shrub    105.0
## 2   Newmex     Tree    124.0
## 3   Newmex     Tree     83.8
## 4   Newmex    Shrub     39.7
## 5   Newmex    Shrub     51.2
## 6   Newmex    Shrub     66.0

## Make a histogram of the LeafArea
qplot(LEAFAREA, data = LeafArea, geom = "histogram", binwidth = 10)
plot of chunk unnamed-chunk-1

## Now look at this same data, log10 transformed
qplot(log10(LEAFAREA), data = LeafArea, geom = "histogram")
## stat_bin: binwidth defaulted to range/30. Use 'binwidth = x' to adjust
## this.
## Warning: position_stack requires constant width: output may be incorrect
plot of chunk unnamed-chunk-1
Ok, now lets see how things look when I scale, then log10 tranform, versus log10 transform, then scale.
## First scale the log transform
LeafArea$ScaleLog <- log10(scale(LeafArea$LEAFAREA))
## Warning: NaNs produced

## Next Lof then scale
LeafArea$LogScale <- scale(log10(LeafArea$LEAFAREA))

## Now plot these two
LeafArea_m <- melt(data = LeafArea, id.vars = c(1:3))
p <- ggplot(LeafArea_m, aes(x = value, colour = variable)) + geom_density()
p
## Warning: Removed 33 rows containing non-finite values (stat_density).
## Warning: Removed 1 rows containing non-finite values (stat_density).
plot of chunk unnamed-chunk-2
Defnitely different in the density plots. What about histograms?
h <- ggplot(LeafArea_m, aes(x = value, fill = variable)) + geom_histogram(position = "identity", 
    alpha = 0.4)
h
## stat_bin: binwidth defaulted to range/30. Use 'binwidth = x' to adjust
## this.
plot of chunk unnamed-chunk-3

Let's try this one more time with simulate data.
# Generate some random data that needs a log transform
Sample_Data <- exp(rnorm(n = 500, mean = 0, sd = 1))
# Plot the data before transform
qplot(x = Sample_Data, geom = "histogram", binwidth = 1)
plot of chunk unnamed-chunk-4
# Plot the data after transform
qplot(x = log(Sample_Data), geom = "histogram")
## stat_bin: binwidth defaulted to range/30. Use 'binwidth = x' to adjust
## this.
plot of chunk unnamed-chunk-4

# Now compare Scaling then log transform vs Log transform then scaling
Sample_Data_Test <- data.frame(ScaleLog = log(scale(Sample_Data)), LogScale = scale(log(Sample_Data)))
## Warning: NaNs produced

h <- ggplot(melt(Sample_Data_Test), aes(x = value, fill = variable)) + geom_histogram(position = "identity", 
    alpha = 0.4)
## Using as id variables
h
## stat_bin: binwidth defaulted to range/30. Use 'binwidth = x' to adjust
## this.
plot of chunk unnamed-chunk-4
I'm not sure what to make of this. It's clear that the order of scaling and log transforming matters. However, I'm not sure which order makes more sense. It certainly seems that Log then Scale produces a nice centered distribution. Though the result seems a bit leptokurtic.
However, one observation that is very clear is that by scaling the data first, I ended up with many values equal to 0, which when then log transformed were assigned NA. This happened in both examples. This definitely leads me to think that the order to do thins is Log then Scale.

Friday, September 13, 2013

Hungry, hungry ... something?

I was out and about at various Long Island field sites this past Monday, collecting Glossy Buckthorn leaves for a colleague in Belgium, and I noticed something I've never seen before - rampant herbivory of Glossy Buckthorn. Here's an example of what it looks like.
I've been visiting various field sites to examine Glossy Buckthorn for about five years now, and I've observed signs of herbivory here and there, but never to this extent. What's more, I was hard pressed to find any leaves that were not chewed on.

I sent an email to a friend at UNH who has studied buckthorn many years now, and asked him if he's seen anything like this. No, he hasn't, but he's heard of this type of herbivory on buckthorn from a colleague in the Kittery, Maine area. So based on this lead, the suspect is the larva of the moth Magusa divaricata. Sadly, these days I'm pretty busy finishing my PhD, doing my postdoc work, finishing up various projects, etc, so I don't think I'm going to be able to squeeze in more field time in the immediate future to seek out what's eating the buckthorn, but maybe I'll get lucky when I go out to collect data later this October (though I suspect the moths will be long gone by then). In any case, it's an interesting observation to stow away and come back to in the future.

Monday, May 13, 2013

What Strunk and White has come to mean to me.

Recently I was offered an excellent post doc position in the lab of Prof. John Silander at the University of Connecticut. This is big for me - it means my years as a grad student (6 so far) are coming to a close, I'll be working in a lab whose research I've been following for many years now, I'll continue to work in plant systems, I'll be applying and greatly expanding my analysis and programing skill set, and on a practical level, I can work in this lab and continue to live on Long Island, where my wife has a good job as an Assistant Professor at Hofstra Medical School. The logistics of my position are bit complicated, but all setup. Those are some of the good things. The challenge has been wrapping up my thesis. You would think that after 6 years my manuscripts would be mostly complete, but reflecting back on my experience, I have begun to realize how little time I spent on my thesis compared to all the other things I've done in grad school. Having not taken any biology since high school, I spent a lot of time taking classes. I also took a lot of classes focusing on math and statistics in ecology. I've done a lot of departmental service related things, which has led me to believe that receiving a Departmental Service Award is both a good and bad sign. And I've been involved in, and continue to be involved in, side projects. Add in TAing, peer reviews for journals, etc., etc., - you get my point. This all adds up to the last few months and next few weeks as being a crunch time for writing, and through this time I've been keeping my copy of William Strunk and E.B. White's The Elements of Style close at hand.

Why the Elements of Style? It is not the book that was used in my college writing class (that was The Bedford Handbook). It's not about scientific writing. For all I know, it may not even be what my writing friends would recommend. But it is highly recommended by many professors in my department,  which is why I picked it up in the first place. Regardless of why I began using this book, it has become quite important to me as a writer. In particular, it has two meanings for me. One, contained within its short descriptions of the rules of writing is the promise that I can become a better writer. I read one of the 'Principles of composition' and think, 'Yeah, that does sound better. I can do that in my writing.' Or I can look at the one of the 'Elementary rules of usage', and then go back to my manuscript, search for instances in which I break a rule, and fix it. I can make my writing cleaner, clearer, and more concise. The second meaning is a bit more symbolic. I like to read a bit from this book before I start writing for the day. I don't necessarily set out to apply what I read, I just find that it puts me in a writing mood. So at the end of a long day of grading problem sets or writing R code, if I look at my copy of Strunk and White, and I know that I didn't crack it open that day, I know I probably didn't do any writing. Sure, this is followed by a pang of guilt, but it also comes with an increased motivation to get some text down the next day, which is ultimately going to get me through writing my PhD.

And that's what Strunk and White has come to mean to me.

Wednesday, March 20, 2013

The Excitement of Data

I am embarrassed to admit it, but I am just now getting around to analyzing the data I collected from the 2012 field season. I do tend to spend the winter months plugging away at computer based projects, and this year has been even busier than years past. I've been working on developing new tools for SDMs and finishing my demographic model sensitivity analysis project, as well as keeping up with my TA obligations and working on an addition to the climate change paper I've discussed previously here. But this post isn't meant to talk about being busy, it's to express my excitement about analyzing another seasons worth of Glossy Buckthorn data.

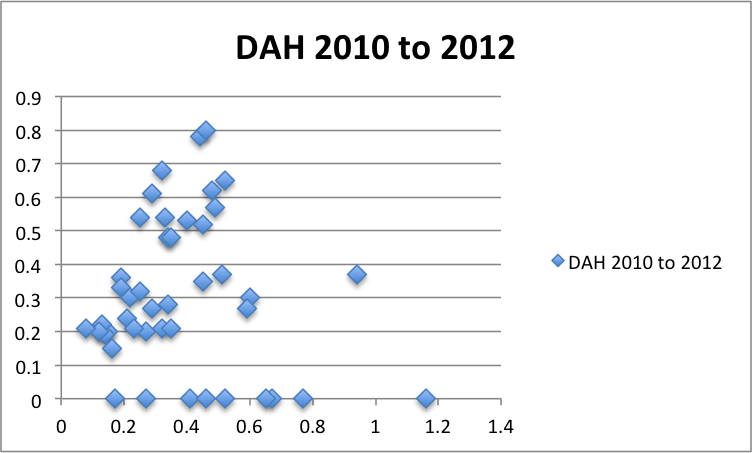
One data set I've collected that I'm particularly keen to look at is from a small buckthorn population in northern New Hampshire, on forest service land.  In the fall of 2010 I marked approximately 150 individual plants at this site. Unexpectedly, during the late summer/ early fall of 2011, this site was mowed. I lost most of my tags, but about 45 remained connected to the cut plants.  Glossy Buckthorn is somewhat notorios for its ability to re-sprout after damage - this is one characteristic that makes it hard to manage. Rather than abandon the site altogether, I decided I would measure the basal diameters (also called diameter at ankle height, or DAH) of the remaining tagged plants.  Here is a preliminary plot of what these results look like, showing basal diameter in 2010 versus basal diameter in 2012.


The x-axis is the DAH in 2010 and the y-axis is DAH in 2012. I can see that some plants are not recovering, however it looks like many have grown quite a bit.  Also, all of the plants with a DAH > 0 represent some form of regrowth - either regrowth of the original tagged stem or growth of new sprouts. A tenacious plant, for sure. I wrote a bit more about this particular site in another post as well.

Simple preliminary plots like this one have me looking forward to poking at my data and getting to my full analysis over the next few weeks.

Saturday, January 5, 2013

Seeing the Forest, or The Importance of Writing

I'm now well into my 6th year of grad school, and partly because of that, I've been doing a lot more writing than in years past.  I'm writing job applications, I'm writing manuscript drafts, I'm writing (occasionally) here on this blog.  And I'll be honest, writing is not always as easy as programming or field work.  In fact, it's almost never that easy.  I haven't mentioned it much on the blog, but most of the research I do is actually quantitative and programatic in nature.  I spend little time in the field compared to how much time I spend working on R code.  That's not a complaint - just a fact.  As the amount of writing I do increases, especially for job apps, it strikes me that this process is very important to help me focus on the bigger picture of my research goals.  

If asked what type of research I do, I'll often say, "I develop quantitative methods to answer questions in conservation biology".  Where do those questions come from? For the past five and half years, they have mostly come from sitting around with my colleagues, discussing some paper, and thinking, "Yeah, but what about this thing they don't talk about ..." or "That seems good, but what would you do to make it even better ...".  Or from talking with other Ecologists and Evolutionary Biologists (particularly my committee members) about some pattern that just hasn't been explained that well.  In a large part, that's how my research project on non-native species lag-phase dynamics has come about.  Let me delve into my own thesis project a bit more - I took this question about lag-phase dynamics (i.e. what's going on during that lag-phase) and said, "ok, given some data, how might I go about understanding the processes going on during that time? I can build a model, simulate the most likely processes, and see if the simulation matches reality." (There you go folks, a description of my PhD in two sentences.) I decided on the "most likely processes", chose the types of models I would need for simulation, and got started.  This is a good project management technique - everything got broken down into little pieces.  Each piece was further subdivided.  The subdivisions get translated into programming projects. The subdivision continues from there.   So where I am now is at a point of wrapping up multiple projects, most of which involve finishing of pieces of code here and there. And it takes a conscious effort to step back and look at the project as a whole. (It doesn't help that the integration of each part of the project is the last step!)  And that's where the writing comes in.  I'm forced to step away from my coding for a bit, and describe the research I do.  It's not writing code - it's posing questions relavent to conservation, then developing ways to answer those questions.  And while I always know this, hours debugging an R script will pretty much clear my mind of everything not related to that script.  So for now, I welcome that time dedicated to writing (like right now), and appreciate the focus it give me, so I'm not missing the forest for the trees.

Tuesday, December 18, 2012

Reviewing the causes of extinction due to climate change

This post is a few weeks late now, but I wanted to discuss a paper I co-lead with another student in my department, Abby Cahill, which recently became available online through the journal The Proceedings of the Royal Society B. We even got the cover photo for the print edition, which is pretty neat!  You can access the abstract for the article here, and if you want a pdf, just drop me a line. 

This article is the result of work a group of us students in E&E at Stony Brook did during, and following, a seminar lead by Prof. John Wiens.  We set out to investigate how climate change has caused documented local extinctions.  We employed systematic review methods, trying as best we could to create a replicable review study.  This was the second systematic review that I participated in.  The other review I worked on was with the Gurevitch Lab, in which we carried out a field synopsis and systematic review of invasive species research.  As authorship order would indicate, I played a much smaller part in that review than this one.  However, working with the Gurevitch Lab members during the early development of their review, I gained an appreciation for the usefulness of these review techniques.  With that said, after writing our climate change review, and a follow up we just sent off for review on the causes of range limits, I do wonder if there are any ways to make literature reviews even better (more on that later).

Back to our review - on some levels what we really wanted to know is if climate change will cause local population extinctions because organisms reach some physiological limit (e.g. it's just too hot) or by some other means (e.g. interruption of some biotic process).  Though my thesis research involves an invasive plant, many of my research interests, and most of my side projects in the Akcakaya Lab, fall squarely in the climate change / conservation biology realm.  So this question really resonated with me.  Carrying out the review yielded two major results. One, for those studies that identify the proximate causes of climate change related extinction, there are many more cases in which disruption of biotic interactions is the cause.  Second, very few studies actually identify a proximate cause of extinction.  This second point actually surprised me, but discussing our findings with more established conservation biologists, few shared in my surprise.  Considering this finding, we also tried to outline some ideas for how we may pursue conservation research to address this lack of knowledge.  Hopefully this review will be helpful to young scientists looking for research ideas.

Beyond this particular review and these particular results, carrying out this review and writing the paper made me start thinking about just how literature reviews are carried out.  At this point, I would say that I am a proponent of the systematic review approach (for background literature have a look at Pullin and Stewart's ConsBio article or the Gurevitch Lab paper cited above - which is open-access).  However, it is certainly not without its faults.  For example, to my knowledge, the best way to carry out a repeatable literature search is to use a set of search terms in a database such as ISI's Web of Science.  I've done searches in this particular database, and indeed, the results are replicable.  However, there is a temporal bias in these databases, due to the fact that many articles published prior to the 1980s do not have digitally indexed titles or abstracts.  Many of my professors have stressed the importance of not ignoring older literature, but how do we get this literature into reviews systematically? Also, there are many examples of these searches failing to find relavent literature.  When this happens we face the question of whether to add literature that we know is relavent, thus making the search results less transparent, or leaving it out, which personally, leaves me with a funny feeling of failing to cover the full 'parameter space' of my potential data, if you will.   I don't have any great ideas about how to address these issues.  At the end of the day, I find some comfort in the idea that a thorough literature search may not return every relavent study ever published, but neither does a transect return information on every plant in a population (or even that transect, given observer error), and as with the transect data, if done correctly we can say we've thoroughly 'sampled' the population.

Another concern I have with systematic reviews is that they often entail extraction of some pieces of data from studies, to be further analyzed (e.g. the number of species examined or the documented causes of local extinction).  This may seem pretty straight forward - the information I want has got to be in the paper, I mean, it was published!  But in practice, data extraction can be quite difficult, especially when you are trying to extract from hundreds of papers with several people.  We employed carefully crafted Google Forms, which despite our "carefulness" needed lots of editing once everyone started using them, and ultimately, lead to us going over our data set several times. An idea that I've been tossing around is to invite the original study authors to help in this process.  Sure, this will not always be possible.  Some authors will not have the time, some will not be able to be contacted, and of course, there's always the possibility that some will not be happy with the way you intend to include their study.  I have no reason to believe this, but I have this funny feeling that someone is going to read our ProcB paper and say "I most certainly did identify the causes of extinction for this species!".  To that I say, while the paper has been published, it doesn't mean the information shouldn't be updated.  Perhaps a review should be an active process? A wiki of some sort? The review authors can set-up the structure, provide their assessment, and then the cited study authors can be invited to edit/add/remove information about their research - with some editorial control by the review authors I suppose.  Sounds like a cool project to me. Also sounds like a lot of time and work.  But perhaps another step forward for literature reviews?