I was out and about at various Long Island field sites this past Monday, collecting Glossy Buckthorn leaves for a colleague in Belgium, and I noticed something I've never seen before - rampant herbivory of Glossy Buckthorn. Here's an example of what it looks like.
I've been visiting various field sites to examine Glossy Buckthorn for about five years now, and I've observed signs of herbivory here and there, but never to this extent. What's more, I was hard pressed to find any leaves that were not chewed on.
I sent an email to a friend at UNH who has studied buckthorn many years now, and asked him if he's seen anything like this. No, he hasn't, but he's heard of this type of herbivory on buckthorn from a colleague in the Kittery, Maine area. So based on this lead, the suspect is the larva of the moth Magusa divaricata. Sadly, these days I'm pretty busy finishing my PhD, doing my postdoc work, finishing up various projects, etc, so I don't think I'm going to be able to squeeze in more field time in the immediate future to seek out what's eating the buckthorn, but maybe I'll get lucky when I go out to collect data later this October (though I suspect the moths will be long gone by then). In any case, it's an interesting observation to stow away and come back to in the future.
Learning to ID plants and other random thoughts and ideas, mostly related to ecology
Showing posts with label Frangula alnus. Show all posts
Friday, September 13, 2013
Wednesday, March 20, 2013
The Excitement of Data
I am embarrassed to admit it, but I am just now getting around to analyzing the data I collected from the 2012 field season. I do tend to spend the winter months plugging away at computer based projects, and this year has been even busier than years past. I've been working on developing new tools for SDMs and finishing my demographic model sensitivity analysis project, as well as keeping up with my TA obligations and working on an addition to the climate change paper I've discussed previously here. But this post isn't meant to talk about being busy, it's to express my excitement about analyzing another seasons worth of Glossy Buckthorn data.
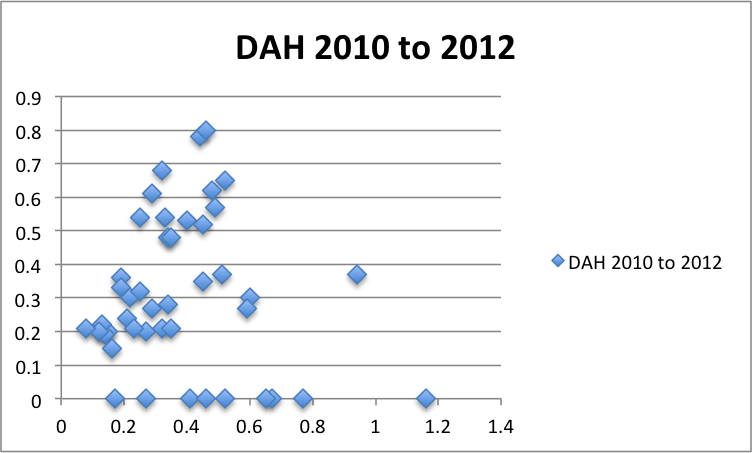
One data set I've collected that I'm particularly keen to look at is from a small buckthorn population in northern New Hampshire, on forest service land. In the fall of 2010 I marked approximately 150 individual plants at this site. Unexpectedly, during the late summer/ early fall of 2011, this site was mowed. I lost most of my tags, but about 45 remained connected to the cut plants. Glossy Buckthorn is somewhat notorios for its ability to re-sprout after damage - this is one characteristic that makes it hard to manage. Rather than abandon the site altogether, I decided I would measure the basal diameters (also called diameter at ankle height, or DAH) of the remaining tagged plants. Here is a preliminary plot of what these results look like, showing basal diameter in 2010 versus basal diameter in 2012.
The x-axis is the DAH in 2010 and the y-axis is DAH in 2012. I can see that some plants are not recovering, however it looks like many have grown quite a bit. Also, all of the plants with a DAH > 0 represent some form of regrowth - either regrowth of the original tagged stem or growth of new sprouts. A tenacious plant, for sure. I wrote a bit more about this particular site in another post as well.
Simple preliminary plots like this one have me looking forward to poking at my data and getting to my full analysis over the next few weeks.
One data set I've collected that I'm particularly keen to look at is from a small buckthorn population in northern New Hampshire, on forest service land. In the fall of 2010 I marked approximately 150 individual plants at this site. Unexpectedly, during the late summer/ early fall of 2011, this site was mowed. I lost most of my tags, but about 45 remained connected to the cut plants. Glossy Buckthorn is somewhat notorios for its ability to re-sprout after damage - this is one characteristic that makes it hard to manage. Rather than abandon the site altogether, I decided I would measure the basal diameters (also called diameter at ankle height, or DAH) of the remaining tagged plants. Here is a preliminary plot of what these results look like, showing basal diameter in 2010 versus basal diameter in 2012.
The x-axis is the DAH in 2010 and the y-axis is DAH in 2012. I can see that some plants are not recovering, however it looks like many have grown quite a bit. Also, all of the plants with a DAH > 0 represent some form of regrowth - either regrowth of the original tagged stem or growth of new sprouts. A tenacious plant, for sure. I wrote a bit more about this particular site in another post as well.
Simple preliminary plots like this one have me looking forward to poking at my data and getting to my full analysis over the next few weeks.
Friday, November 23, 2012
Management and Resilience
The White Mountains of New Hampshire is the place that inspired me to study ecology. So when I was coming up with my PhD project I wanted at least some of my field work to be in this region. (As an aside, one of the bonuses of the PhD program at Stony Brook is that you can develop a project independent of your adviser's research program, so to some extent, you can choose where you want to work.) In fact, while I was developing my project, I contacted the Botanist for the White Mountain National Forest and asked him if there were any non-native plant species he thought were particularly concerning. Glossy buckthorn - that was his first answer. So as I've described a bit here, in 2009 I set up my first transect about a 1/2 mile or so from the trailhead of the Winniweta Falls Trail.
I'll leave a discussion of the physical characteristics of this site for another post. Today I want to share some of my observations from here, which I think demonstrate the tenacity of Glossy Buckthorn. In September of 2010, I marked 147 individual plants along three 30m transects in a field heavily infested with Glossy Buckthorn. This field was just one of several open fields in the area (along the Jackson Ski Touring trails, for those of you who are curious) that had a high density of buckthorn. I believe these areas are maintained as open fields to provide wildlife habitat for organisms such as moose.
A little out of the field of view of the picture above, I set down one of my three 30m x 1m belt transects, which contained 115 buckthorn plants. As you can see below, many of these plants are taller than my 2m measuring pole.
I received permission from the Forest Service to sample at this location, I even have a letter on official USFS letter head, so I was pretty confident that my site would go undisturbed after setting up my transects and tagging the plants. Plus, this isn't a high traffic area for hikers. But between my 2010 visit and my 2011 visit there were to major storms, including Hurricane Irene, that flooded the area, so I was expecting some impacts. But I was pretty shocked when I showed up the Fall of 2011 to this!
And here's that transect that had all of those greater than 2m tall plants.
As it turns out, there was some miscommunication and this locale was approved for a mowing. It would be foolish to harbor any bitterness about a destroyed site. After all, the forest service is just trying to manage this invasive plant and keep this wildlife opening, well, open. But I do have to wonder if the mower thought twice about running over orange flags, plants marked in a line with flagging tape, or plants clearly marked with shining little metal tags.
So, seeing this for what it was, I collected the tags I could find, measured the basal diameter of the plants who still had tags attached to them (hey, after all, that's a years worth of growth in basal diameter I could measure there, even if I couldn't say much about height), and left with the plan to come back in 2012 and see what happens. You see, buckthorn is notoriously tenacious - it re-sprouts quite readily. The most affective way to manage buckthorn is to cut it and immediately apply a weed killer (this is based on research reported in several papers, many from the Natural Areas Journal). I had a suspicion I would come back in a year and see plenty of re-growth. Of the 147 plants originally tagged, I was able to leave 44 and recover 45. That left 58 unaccounted for. Given how high the flood waters came from the two large storms that hit this area in 2011, I suspect that many of them are in the Ellis River or along its banks. This season I returned to Winn Falls and was tacken aback by the amount of re-growth.
I haven't completely entered and analyzed these data, but taking a quick peak, about 5 of the 44 left were dead. Three more were missing. And it looks like on average there was about 40cm of re-growth. Also, many of them had multiple basal stems. I suspect returning next year I will find many of these with fruit on them. Ultimately, these data may not make into my population model. My sample size is very small (38 plants - lost 8 and gained 2 this year). But I think these data are still interesting. They make me wonder how affective a management strategy that involves cutting every couple of years can really be. Also, before the mowing, this field was a giant reservoir of Glossy Buckthorn seeds. I can't help but think about the role this reservoir might play in the spread of buckthorn into nearby logging sites or down river.
| Dense Glossy Buckthorn cover in an open field near Winniweta Falls Trailhead |
| Transect 3 - Many buckthorn platns taller than my measuring pole! |
| Winn Falls site after mowing |
| Transect 3 - after mowing |
So, seeing this for what it was, I collected the tags I could find, measured the basal diameter of the plants who still had tags attached to them (hey, after all, that's a years worth of growth in basal diameter I could measure there, even if I couldn't say much about height), and left with the plan to come back in 2012 and see what happens. You see, buckthorn is notoriously tenacious - it re-sprouts quite readily. The most affective way to manage buckthorn is to cut it and immediately apply a weed killer (this is based on research reported in several papers, many from the Natural Areas Journal). I had a suspicion I would come back in a year and see plenty of re-growth. Of the 147 plants originally tagged, I was able to leave 44 and recover 45. That left 58 unaccounted for. Given how high the flood waters came from the two large storms that hit this area in 2011, I suspect that many of them are in the Ellis River or along its banks. This season I returned to Winn Falls and was tacken aback by the amount of re-growth.
| Transect 3 - one year post mowing |
Monday, November 5, 2012
After the storm
I'm lacking time to do a fuller post these days, which is sad because I have several ideas bouncing around my head. I'll try to make some time later this week. In the mean time, this is just a quick note to say that I'm very curious what, if any, the affect of Hurricane Sandy will be on my Long Island field plots. I finished this season's work in the UNH area about a week and a half ago, and was planning to visit Caleb Smith last week, but obviously that plan was changed. For now, Caleb Smith is closed to the public, so it may be some time before I can finish this year's work. I'll do a post once I collect this data. Everyone stay safe for now.
Thursday, October 18, 2012
In the field with my wife
My wife is so awesome that she insisted on using two of her floating holidays to help me out in the field in my southern New Hampshire sites this past September. It was great to have Gina in the field for multiple reasons. First, not to get too cheesy, but I really enjoy hanging out with her. Second, field work goes so much faster with another person. Third, it was interesting to get some new ideas about doing field work from someone who isn't as tied up in the project as myself.
One of the best ideas Gina had for me was to draw a rough map for each of my quadrats, showing the general position of each tagged plant in the plot. At first, this seemed like an awful lot of work, but thinking about it a bit further, and failing to find a few of last seasons marked plants, made me reconsider. If you have ever tried to find tagged plants you know that sometimes it's very hard. A year's worth of debris has accumulated, often times hiding tags under a layer of compost. Some researchers employ tricks and tools such as using a metal detector. I have not gotten to this point - partly because I cant afford a metal detector. So, lacking a metal detector, I'll dig around in the duff for upwards of 30 minutes looking for a single tag. Here's what I imagine a quadrat map might look like.
The numbers indicate the tag number for each plant. Clumps of plants with sequential tags might be listed together with a general shape of the clump. Distinguishing characteristics, such as the presence of a particularly large tree would be noted. Etcetera. I really like this idea, and I don't think it will take much time to sketch out such maps in the field when tagging plants. Next season, as I prepare to make some of my sites longer term monitoring plots (i.e. places to go back to after I finish my PhD) I think I'll start making these quadrat maps.
| Gina, ready to measure some plants! |
![]() |
| An example of a 'quadrat map' |
| Happy field workers at the end of the day! |
Thursday, September 6, 2012
Niche models, the (sub)urban environment, and my uncle's backyard
I use ecological niche models and species distribution models fairly extensively in my research - both my thesis work and side projects. For some time now my advisor has been involved in projects that link these types of models with population projection models, so when I was thinking about researching the patterns and processes of the invasion of Glossy buckthorn, it made sense to me that I would employ similar techniques. Additionally, I have only found a dozen or so unique presence records for Glossy buckthorn here on Long Island, so I thought it may be good do a SDM focused just on the island here. I haven't completed this part of my project, so don't get excited, I don't have any results to share with you yet. Anyhow, I've spent a fair bit of time gathering more occurrence locations from numerous public lands (parks and what not) in Nassau and Suffolk County, and had been thinking that carrying out an SDM would be pretty straight forward.
SIDE BAR: Looking for invasive species is a bit funny for me. When I go to a new location that I think is likely to have buckthorn, I'm giddy with anticipation. I'm excited when I find it and disappointed when I don't. Now, objectively speaking, if buckthorn is in fact having a strong negative effect on native ecosystems (most likely the case in my New Hampshire populations), then shouldn't I be happy when I don't find it? Yeah, it's complicated I guess...
Ok, back to modeling, and how spending time in the field has affected my thinking. One thing I tend to think about often when in the field is how Glossy buckthorn got to that particular spot? Where is the nearest, next-oldest, population? Glossy buckthorn seeds can be dispersed by any one of the many bird species that eat its fruit, but not too far. The fruit has a laxative effect (on humans too), so birds don't hold it, or the seeds, for long. Because nearly all of my field sites are embedded in suburban areas, they all have at least some length of border shared with someones backyard. At my Long Island sites, I can see backyards from many of my plots. Initially I hadn't thought much of this, but while visiting my uncle and his family in New Jersey a while I back, I noticed that there in the unmaintained garden next to the patio there was a Glossy buckthorn tree. Me - "Uncle Joe, did you plant that tree?" Uncle Joe - "Oh no, that came with the house." So there you have it, people in the suburbs may be inclined to plant this tree in there backyard.
What are the implications of this on my models and how I use them? I'm not sure yet. On the one hand, it makes me think of possible uses of high-res remote sensing and how it may be used to determine what types of plants are growing in urban and suburban yards. This technology and its applications are improving rapidly, and we are getting to the point that identification of individual species from satellite imagery may be possible. (Yeah, that's crazy!) On the other hand, can I use the results of my distribution models to identify distances between populations if plants in your neighbors backyard are actually the source for my populations? I'm not sure, and will definitely be giving this more thought as the project progresses in the near future.
SIDE BAR: Looking for invasive species is a bit funny for me. When I go to a new location that I think is likely to have buckthorn, I'm giddy with anticipation. I'm excited when I find it and disappointed when I don't. Now, objectively speaking, if buckthorn is in fact having a strong negative effect on native ecosystems (most likely the case in my New Hampshire populations), then shouldn't I be happy when I don't find it? Yeah, it's complicated I guess...
Ok, back to modeling, and how spending time in the field has affected my thinking. One thing I tend to think about often when in the field is how Glossy buckthorn got to that particular spot? Where is the nearest, next-oldest, population? Glossy buckthorn seeds can be dispersed by any one of the many bird species that eat its fruit, but not too far. The fruit has a laxative effect (on humans too), so birds don't hold it, or the seeds, for long. Because nearly all of my field sites are embedded in suburban areas, they all have at least some length of border shared with someones backyard. At my Long Island sites, I can see backyards from many of my plots. Initially I hadn't thought much of this, but while visiting my uncle and his family in New Jersey a while I back, I noticed that there in the unmaintained garden next to the patio there was a Glossy buckthorn tree. Me - "Uncle Joe, did you plant that tree?" Uncle Joe - "Oh no, that came with the house." So there you have it, people in the suburbs may be inclined to plant this tree in there backyard.
What are the implications of this on my models and how I use them? I'm not sure yet. On the one hand, it makes me think of possible uses of high-res remote sensing and how it may be used to determine what types of plants are growing in urban and suburban yards. This technology and its applications are improving rapidly, and we are getting to the point that identification of individual species from satellite imagery may be possible. (Yeah, that's crazy!) On the other hand, can I use the results of my distribution models to identify distances between populations if plants in your neighbors backyard are actually the source for my populations? I'm not sure, and will definitely be giving this more thought as the project progresses in the near future.
Wednesday, August 29, 2012
On how I chose my samples - Part 2
Here are a few of the standout observations that helped me develop my sampling scheme:
- Glossy buckthorn patches vary in density and I wanted to avoid over-representing plants in areas of high density or under-representing plants in areas of low density
- For the purposes of my study I want to follow individuals, therefore areas that are bare of Glossy buckthorn are not good places to look for plants to follow (yeah - this one is obvious)
- Glossy buckthorn grows in varying ecological conditions (under story, gaps, riparian zones, uplands, etc.) and my samples should come from as many of these conditions as is feasible
- The ecological conditions mentioned above are generally clumped. That is, the ecological conditions I'm interested in usually make up their own patch (e.g. a large patch of understory or wetland)
With these observations and thoughts in mind, I decide that the most important aspect of my sampling scheme should be that I select individual plants to follow across different plant densities and in different ecological conditions. So here's the final sampling scheme I chose:
- Ecological conditions - I selected a specific combination of ecological conditions (e.g. upland-understory forest) and using a GPS outlined the borders of a Glossy buckthorn infestation within the bounds of the borders of the ecological condition.
- Individual plants - Once I had the border of an infestation, I selected 15 to 20 random points within these bounds where I set up 2x2m plots, or quadrats. Within these plots, I tagged and measured all Glossy buckthorn plants that were taller than 10cm. Plants smaller than 10cm were considered saplings, which were sampled differently.
This type of sample scheme is essentially a stratified-random design, stratified across ecological condition and random within that condition. So far I think it has worked out pretty well.
| Random 2x2m plot in a large forest gap. Orange flags mark the corners of the quadrat. |
Monday, July 23, 2012
Pros and Cons of Local Field Work
My field sites are all within a day's drive of my home. Albeit it's a long day's drive to my sites in northern New Hampshire, but still, far easier to reach than some of my colleagues international field sites. Three of my field sites are right here on Long Island, less than 30 minutes from my office. I didn't necessarily pick my field sites out of convenience, but it's a nice bonus. After college I spent two-plus years working as a Backcountry Caretaker for the Appalachian Mountain Club in the White Mountains of New Hampshire. This experience, combined with numerous outdoor adventures throughout the northeast with my family during my childhood, instilled in me a deep love and appreciation for northeast deciduous and boreal forests. So, when I came to grad school to study ecology, I naturally migrated to a project that I could do in this forest type.
Working close to home has many perks. For example, generally I can look at a weather forecast and pick the nicest days to head out to my sites. Generally I don't have to go out into the field during a down pour or a 100+ degree day. Not that I don't spend time in the field during crappy weather, but for my Long Island sites, I can usually avoid it. Another benefit is that I can go out to my sites just to satisfy my curiosity about field methods that pop into my head while I'm looking at my data. "I wonder if fruit count on these plants markedly differs in July versus August versus September?" Well, I can just head out and look at my plants.
However, there are a few cons I've experienced with having field sites so close to home. For example, being so close to the office, I'm available to go to lab meetings, thesis defenses, random talks of interest, etc. These events seldom take more than a few hours a piece, but it's enough to eat into my field work time. Also, there's other projects I'm working on that feel more urgent at times - 'I can't go into the field today. I have to finish gathering data for project X!'
For me, and for many others too, being successful at grad school requires good time management. Field work always requires time management, but having my field sites so nearby requires me to treat field visits like any other day-to-day task I have. I often talk about my 'field season' as though it's a discreet period of time, but in reality, it's really a portion of the year during which I shuffle in a few more tasks into my daily life.
Update: Since I wrote this short post, another researcher has also written a great piece on doing local field work. I figured I'd link to it here:
http://dynamicecology.wordpress.com/2013/08/28/in-praise-of-boring-local-field-sites/
Working close to home has many perks. For example, generally I can look at a weather forecast and pick the nicest days to head out to my sites. Generally I don't have to go out into the field during a down pour or a 100+ degree day. Not that I don't spend time in the field during crappy weather, but for my Long Island sites, I can usually avoid it. Another benefit is that I can go out to my sites just to satisfy my curiosity about field methods that pop into my head while I'm looking at my data. "I wonder if fruit count on these plants markedly differs in July versus August versus September?" Well, I can just head out and look at my plants.
| Counting fruit in July |
For me, and for many others too, being successful at grad school requires good time management. Field work always requires time management, but having my field sites so nearby requires me to treat field visits like any other day-to-day task I have. I often talk about my 'field season' as though it's a discreet period of time, but in reality, it's really a portion of the year during which I shuffle in a few more tasks into my daily life.
Update: Since I wrote this short post, another researcher has also written a great piece on doing local field work. I figured I'd link to it here:
http://dynamicecology.wordpress.com/2013/08/28/in-praise-of-boring-local-field-sites/
Thursday, July 12, 2012
On how I chose my samples - Part 1
One of the early challenges I had in doing field work was deciding how to chose plants to measure and tag for long-term monitoring. At this point, I have read quite a bit about this topic and always take notice of descriptions of this process when they appear in papers. Sadly, such descriptions generally consist of a sentence or two buried somewhere between 'Study Species' and 'Study Site'. I did not have any formal field ecology experience prior to starting graduate school and my research adviser doesn't have any field based projects, so I felt a bit on my own in coming up with a sampling scheme. That's not to say that I didn't get advice from some very smart and experienced folks - just that at the end of the day, I had to cobble together a sampling scheme based on lots of reading, a fair bit of discussion, and a very small amount of experience.
My small bit of experience came by way of working as a Graduate Assistant to the chair of the department here at Stony Brook, Dr. Jessica Gurevtich. Dr. Gurevitch and her colleagues have been monitoring the post-fire recruitment and demography of pitch pine (Pinus rigida) here on Long Island since 1996. The fire that affected these field sites was in 1995, and growing up near by, I remember it fairly well. Some of the results of this research have been published (Landis et al. 2005; Fang et al. 2006). As Dr. Gurevitch's GA, part of my job was to help out with the Pine Census during the summer of 2009, which that year was organized by my friends Adam and James. In total, over the years well of 6000 pitch pine trees have been tagged with either plastic bird-band tags or aluminum tags, and once every two years a group of people would go out into the Long Island Pine Barrens, search for these marked plants, and take measurements - such as diameter at ankle height, diameter at breast height (DBH), height, presence/number of cones, etc. When the census was initially established, 45 square 5x5m plots were distributed across various tree stands within three landscapes. All pitch pine plants, and those that emerged during the study period, within these 45 plots have been tagged and measured. It's a lot of work and a lot of data! So when I set to designe my sampling scheme, I had some notion that it would involve square plots and marking all of the Glossy Buckthorn plants inside of those plots with aluminum tags.
Ok - plots and tags - that made sense. However, the few papers actually related to Glossy Buckthorn that I had found (nearly all from groups at UNH associated with either Drs. Tom Lee or Robert Eckert) had used transects. And transects seemed so much easier! Lay down a measuring line, then walk along it. So, near the end of the summer of 2009, I head up north to the White Mountain National Forest (WMNF), walked into a field of Glossy Buckthorn and laid down a transect.
And this is when I learned that transects are not always the best option. For one, I wanted to place the transect down in a random spot, and what that meant was that my tape was laid down right next, but not touching, a large patch of buckthorn. Moving my tape would be biasing my data collection, but not having my tape touching any buckthorn made that transect useless. Then, I couldn't help but notice that some of my transects went through incredibly dense stands of buckthorn, with trees that had pretty low fruit count, while other transects went through very sparse stands of buckthorn, but each tree had hundreds, if not thousands of fruit. Hmm ... and this lead to a realization I should've had much earlier - before you decide on a sampling scheme, you have to know what you're planning on doing with the data you collect. And I don't mean have some vague notion like, 'I'm going to make a demographic model!', I mean, you need to know what values you need to estimate, how much error is acceptable, how you're planning on dealing with outliers and missing data, and there's a whole slew of other things to think about carefully. So I headed back to Stony Brook and gave this a lot more thought. And that I'll talk about in the next post.
References:
Landis et al. 2005. Variation in recruitment and early demography in Pinus rigida following crown fire in the pine barrens of Long Island, New York. Journal of Ecology 93(3):607-617.
Fang et al. 2006. Sources of variation in growth, form, and survival in dwarf and normal-stature pitch pines (Pinus rigida, Pinaceae) in long-term transplant experiments. American Journal of Botany 93(8):1125-1133.
My small bit of experience came by way of working as a Graduate Assistant to the chair of the department here at Stony Brook, Dr. Jessica Gurevtich. Dr. Gurevitch and her colleagues have been monitoring the post-fire recruitment and demography of pitch pine (Pinus rigida) here on Long Island since 1996. The fire that affected these field sites was in 1995, and growing up near by, I remember it fairly well. Some of the results of this research have been published (Landis et al. 2005; Fang et al. 2006). As Dr. Gurevitch's GA, part of my job was to help out with the Pine Census during the summer of 2009, which that year was organized by my friends Adam and James. In total, over the years well of 6000 pitch pine trees have been tagged with either plastic bird-band tags or aluminum tags, and once every two years a group of people would go out into the Long Island Pine Barrens, search for these marked plants, and take measurements - such as diameter at ankle height, diameter at breast height (DBH), height, presence/number of cones, etc. When the census was initially established, 45 square 5x5m plots were distributed across various tree stands within three landscapes. All pitch pine plants, and those that emerged during the study period, within these 45 plots have been tagged and measured. It's a lot of work and a lot of data! So when I set to designe my sampling scheme, I had some notion that it would involve square plots and marking all of the Glossy Buckthorn plants inside of those plots with aluminum tags.
Ok - plots and tags - that made sense. However, the few papers actually related to Glossy Buckthorn that I had found (nearly all from groups at UNH associated with either Drs. Tom Lee or Robert Eckert) had used transects. And transects seemed so much easier! Lay down a measuring line, then walk along it. So, near the end of the summer of 2009, I head up north to the White Mountain National Forest (WMNF), walked into a field of Glossy Buckthorn and laid down a transect.
| One end of a transect in WMNF |
References:
Landis et al. 2005. Variation in recruitment and early demography in Pinus rigida following crown fire in the pine barrens of Long Island, New York. Journal of Ecology 93(3):607-617.
Fang et al. 2006. Sources of variation in growth, form, and survival in dwarf and normal-stature pitch pines (Pinus rigida, Pinaceae) in long-term transplant experiments. American Journal of Botany 93(8):1125-1133.
Wednesday, July 4, 2012
Another Field Season Begins
While carrying out my field work in the past I've often thought, "Hey, it would be nice to document some of the thoughts that pop into my head while standing out here measuring plants." Most of these thoughts have been related to the process of trying to figure out how exactly to go about doing my field work. Perhaps they may blossom into something useful to me, or perhaps someone else might find them interesting. Regardless, I should write them down. And so, I thought I could use some motivation to write and the world probably has room for another blog. I have every intention of writing about ideas that are not born from my field work too, but this seems like a good place to start. Here's a picture of how happy I look when standing in a thick patch of Glossy Buckthorn (F. alnus), a non-native plant I'm studying as part of my Ph.D. dissertation work. I'll discuss it more later, but I also have a blurb about my research here.
For now, let me explain this blog's logo, the image to the right that reads 'Ecologist at Work'. As an ecologist, I'm working towards being many things: a conservation biologist, a quantitative ecologist, a plant ecologist. It is in working towards the latter that I get to do my field work. My field sites are generally pretty close to hiking trails. There are a few reasons for this that I can think of: 1) non-native plants generally grow closer to places that are disturbed, such as roads and trails; 2) many of my sites are in fairly developed areas (e.g. Long Island, NY and southern New Hampshire), thus every plot of woods is either near a trail or a road or someones backyard; and 3) ok, I admit it, access to sites near trails is much easier. However, even though I'm am near trails, my plots are still off into the woods a bit. So, while someone is out enjoying a walk in the woods or a jog through the park, they may stumble upon a scene in which a relatively dirty looking man is thrashing around the bushes, just off the trail, with a long stick (a measuring pole) or a saw (to take samples). Or perhaps they may see a man quietly crouched behing a tree (measuring the basal diameter of a plant). In any case, the hiker usually appears pretty sketched out. Last season I had the thought that I needed a folding sign that said 'Ecologist At Work' to put out in the middle of the trail, something to let hikers know that there may be someone just off in the woods cursing about falling into a black berry bush, again. Mostly this thought was in jest, but during my first field day this year, I looked up from my measurements just in time to see a young jogger come around a corner, see me, and promptly turn and run back the way she had come. I thought, "I really need that sign". So I enlisted the help of my awesomely talented sister-in-law, Andrea Sorrentino, and she put together this awesome designe. Next step, get it printed out on a folding construction sign! So if you see such a sign in the woods, just say hi to the ecologist off in the woods.
Subscribe to:
Posts (Atom)